
Find Your Edge
In our previous lesson we established the fact that exit rules dictate the base win rate of a trading or investing system. Knowing this win rate allows a person to place the system into a specific probability profile (33% for risk 1 to make 2, 50% for risk 1 to make 1, and so forth). However, these base winning percentages merely achieve break-even results before commission costs. They do not guarantee that the trading system will make money and compound gains over time.
A person needs a statistical improvement over and above their base win rate to enjoy profitable trading. If a person’s breakeven win rate was 33% but their actual win rate was 35%, they’d have a positive 2% trading edge.
A trading edge is the statistical improvement over and above their base win rate. The statistical trading edge does not have to be very large. If a trader can win at a rate that is four to seven percent more than their breakeven winning percentage, they that will typically be enough for them to expect to be profitable if they also carefully follow the rest of their trading process’s rules.
The trading edge must be larger for systems that win more frequently. The following table gives the working ranges for each of the 5 defined Natural Trading Styles:
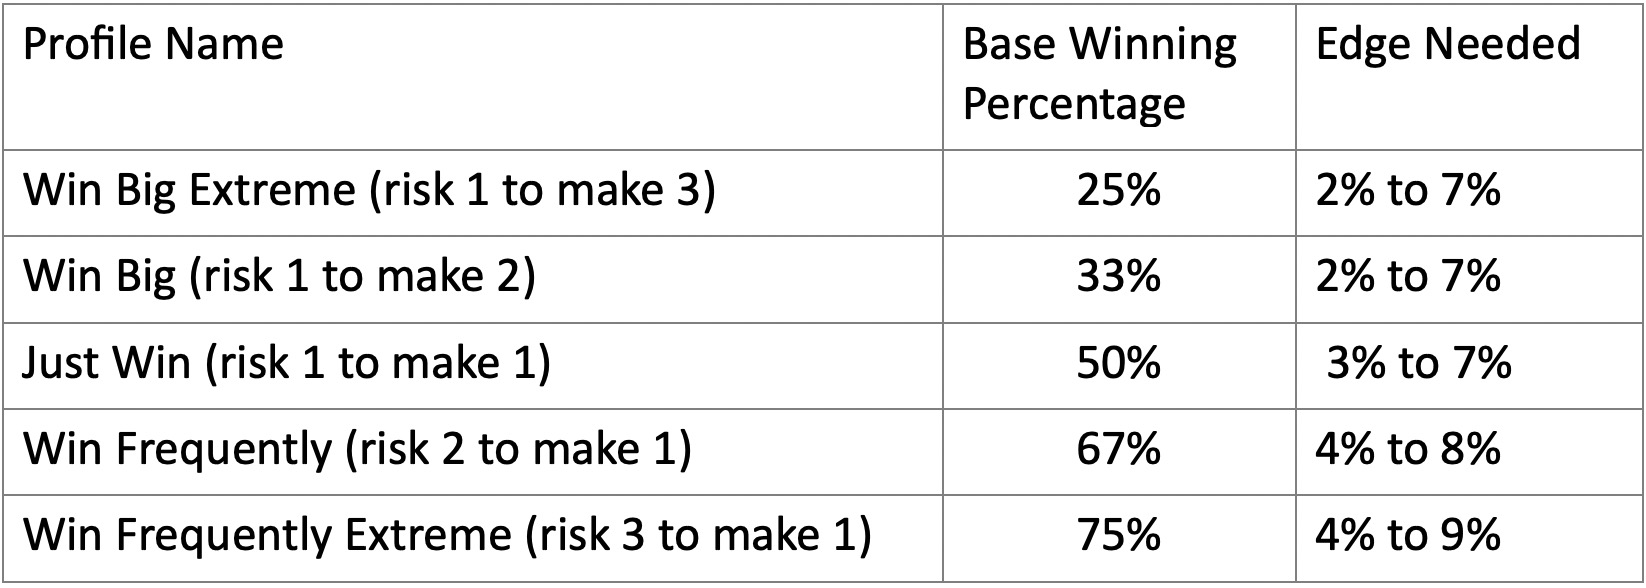
In prior lessons we established the fact that exit rules (not entry points) dictate the base winning percentage of the strategy. Knowing your Natural Trading Style and its related base winning percentage allows you to choose a trading strategy that fits you best and gives you the best chance of having consistent profits from the market.
This is a great initial start, though base winning percentages merely achieve break-even results before commission costs. The only way to guarantee that the trading system will make money and compound gains over time is gain and consistently maintain a trading edge.
There are thousands of ways people have tried to gain a consistent and predictable trading edge. Any technical analysis or other type of analysis is a manifestation of working to gain a reliable trading edge. While these sorts of techniques and tactics are helpful, they can also be confusing and, if used incorrectly, contradictory.
Understanding what your trading edge is and how you obtain it is important as you begin your quest to become a highly consistent trader. One way to accomplish this is to find the appropriate edge technique for your desired annual trading frequency and asset class. Not all tools will apply across all time frames or asset classes.
For example, someone desiring an annual trade frequency over 500 would not find insider trading a metric giving them enough trade ideas or entry points. However, those who use the VWAP on 15 minute charts may not be able to place just 100 trades a year.
Many part time traders mistakenly believe that their trading edge must be large to be profitable. This is not the case. Those who experience large success in the markets understand their natural probability profile, only use strategies that keep them trading from strength, and develop other ways to improve their edge. This lesson will provide three universal ways traders improve their edge. As you get deeper into your curriculum, you’ll learn additional edge techniques associated with your natural trading style and corresponding trade strategies.
Ways to Gain a Trading Edge
Individual Investors and traders who recognize that they need to find an edge in the markets assume that an edge must be difficult to find.
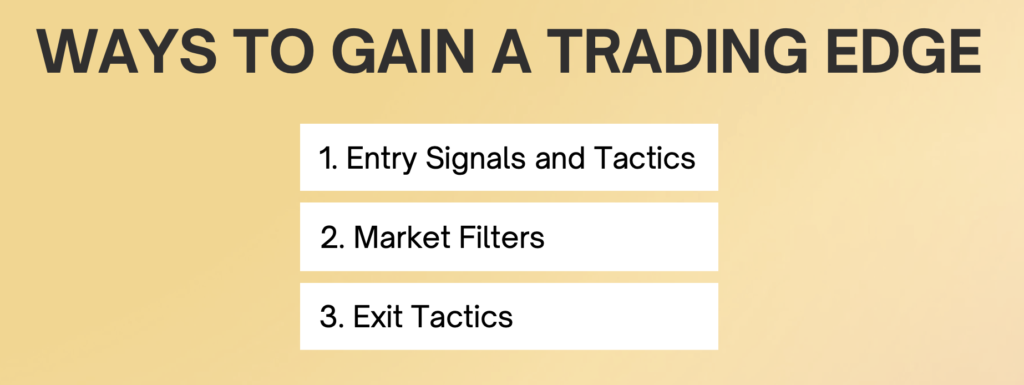
While it is true that some market anomalies do require significant effort to unearth, the reality is that successful traders make their edge on surprisingly simple concepts that persist in the market. In fact, there are three simple areas where you can begin to find an edge in your trading:
- Entry Signals and Tactics: These are the ways you generate trading ideas, from the pre-built screens and analysis in our research tool to trusted research providers or newsletters you choose, there are many ways to identify good market opportunities. These can account for an extra 1 to 5% gain in edge all by themselves.
- Market Filters: These are rules that tell you strategies (bullish or bearish) to use at any given time. Market filters help you identify the trend of your market and know what to do about the trend you observe. These rules can improve your edge by 1 to 2%.
- Exit Tactics: How you adjust your stop loss, where you set your profit targets, and whether or not you exit your entire position or just a portion of it, can magnify your trading edge by 2 to 3%.
These are merely the basic ways in which you can begin to gain an edge in your trading. There are more advanced ways that you might learn from your instructor. This lesson will explain each of these three categories of trading activities in detail, so that you can statistically improve your winning percentage over and above the base win rate of your probability profile.
Other ways to gain an edge can be learned and layered into your trading. But one word of caution. Layering in too many edge techniques or using those which don’t match your desired trade frequency and Natural Trading Style is dangerous.
All traders, and especially new traders, may be tempted to add additional trading edge techniques to avoid loss and increase the size of gains. This is a natural temptation. Yet it won’t work. Too many edges techniques will begin to provide conflicting and contradictory signals which will confuse and paralyze you. Avoid this temptation.
Entry Signals and Tactics

Determining which equity to buy and when to buy it is the primary focus of most market participants. Intuitively, this decision seems to matter more than any other.
The reality is that this is just one of many important decisions, none of which is individually so powerful that it guarantees you will ultimately close the trade with a profit. Instead of spending a great deal of time looking for the perfect entry point, the better approach is to focus your attention on exactly following your entire trading plan.
The combined effect of following your system exactly (e.g. entries, exits, risk per trade, and trade frequency, etc.) versus focusing too much on entry points will consistently yield profitable results over many trades.
Determining which stock to buy and at what price to buy it can consume a lot of valuable time and lead to “paralysis by analysis,” where no trade is made. Trusting the system you’ve chosen helps make this process more efficient. It can also make sense to have a couple of strategies for quickly screening stocks to trade.
If you find yourself spending more time trying to determine which stock to trade (and what price to buy it), and less time on determining where to exit the trade or how much to put into the trade, or how to adjust the trades you have on already, then you are probably spending too much time on this part of the system.
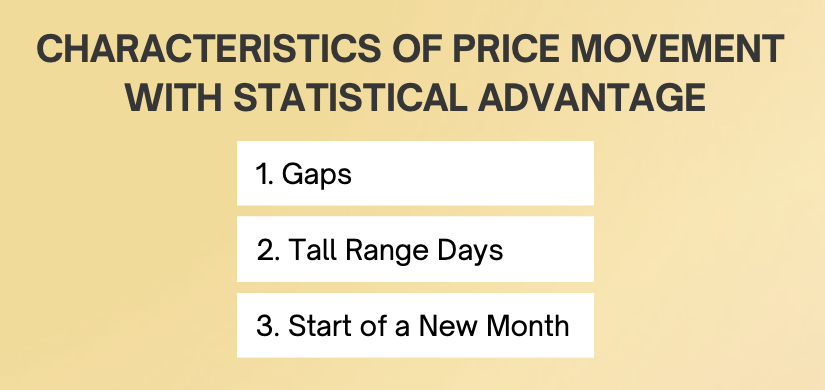
There are several characteristics of price movement in which persistent statistical advantage can be found. This lesson will detail three of them: gaps, tall range days, and the start of a new month.
Gaps
An extensive study conducted by researchers and published in the Journal of Technical Analysis in the year 2013, concluded that an overnight jump in the price of a stock actually implies an improved statistical probability that the stock will outperform the S&P 500 in the next month. This is a fascinating finding and it seems to hold true as a bullish indicator in bull and bear markets alike. The researchers found that the most productive gaps were those that were large enough to signal a potential change trend from a downward to a new upward trend. To identify such gap movements, three characteristics were determined to be beneficial:
- The gap should cross the 10-day simple moving average:
This means that the closing price before the gap should be below the 10-day moving average and the closing price after the gap should be above the 10-day moving average. - The size of the gap should be larger than the Average True Range (ATR):
This means that the size of the gap (from the previous day’s high to the lowest price on the day after the gap) should be larger than the average daily price range of the past 10 days. - The day after the gap should close higher than it opened:
This means that the day should be a bullish candle (usually white or green on most candle charts), and preferably one that closed closer to its high. This gives bullish evidence that whatever caused the gap was followed up by additional enthusiastic buying.
- The gap should cross the 10-day simple moving average:
Gap signals that exhibit these characteristics were shown to have a 58% to 60% probability of outperforming the S&P 500 over the following month. Notice that this is not a wins-every-time signal, but it has a significant advantage over outcomes generated at random and can therefore improve your trading edge.
These three gap characteristics can be searched for in many common screening tools. If you are interested in adding these to your arsenal of trading ideas, check in with your instructor and class for some ideas about which tools you can use to find stocks that have these characteristics.
Tall Range Days
Studies show that bullish entries made immediately AFTER a tall candle that opens low and closes high and is at least 1.4 times larger than the ATR of the last 10 days also exhibit roughly a 60% probability that they will outperform their benchmark over the following month.
To find such signals you would simply search for stocks that held the following characteristics:
- A daily move at least 1.4 times larger than 10-day ATR:
This means that the size of the candle body (from the low to the high price of the day) should be at least 1.4 times larger that the average move from low to high (daily ATR) of the previous ten trading days. - The stock should open near the low for the day:
This means that there should not be much of a low shadow (or wick) protruding lower from the candle body. - The stock should close near the high for the day:
This means that the stock should close towards its high and there should not be much of a tall shadow (or wick) protruding higher from the candle body.
- A daily move at least 1.4 times larger than 10-day ATR:
It isn’t difficult to search for stocks that have traded with an unusually high ATR for the day, but the last two characteristics are a bit more difficult to find with most screeners.
You will most likely have to visually confirm the best one or two trades to select from the search results.
In his book, New Trading Systems and Methods, fifth edition, author Perry Kaufmann identifies the fact that the opening price of the trading day is eight times more likely to be very near the high or low for that day’s price movement than at any other time of the day. He also notes that this fact has held true for over fifty years.
Why should this be? The answer is that even random prices trend, and the opening price of the day kicks off a trend in one direction or another more often than not. Additionally the first few minutes of the trading day are, by far, more active than any other similar time frame on average.

Beginning and End of a Month
A working paper released on ssrn.com in 2012 detailed what it called “a curious seasonal anomaly” referred to as the turn-of-the-month effect. It showed that buying stock near the end of the month provided statistically significantly better returns than entries on other days of the month. Think about it. The largest participants in the markets are those who manage billions of dollars in defined retirement plans such as 401(k) plans. These funds receive an influx of new capital to invest from pay periods often timed to the beginning or the end of the month.
Additionally, many of these funds track performance on a calendar-month basis. This monthly performance report often leads these fund managers to buy and sell dramatically in a “window dressing” effort to make their results look better. Thus entry signals on stocks where fund managers have decided to add significantly to their holdings, may show up in the last two or three days of the month or on the first day of the month. If so, these are likely to be more productive entry times than other days of the month.
To take advantage of this anomaly, a person could do one (or all) of three things:
- ONLY enter stocks during the last week of the month:
This actually makes sense for people who want a very low-maintenance strategy where they may be making trading or investing decisions only once a month or so. For all others, this may not be a practical response. - Be slightly more aggressive in the last week of the month, and slightly more conservative during all other weeks:
This could be implemented in any number of ways that your instructor could help you identify. One example of a simple implementation is that a person could add a rule that allows them to add three new positions in the last week of the month, but prohibits them from adding more than two new stocks in any other week. Even a small adjustment to your trading strategy such as this one could produce a significant edge in your results. - Add end-of-month as one of their decision factors:
This means that a person who had a checklist of factors to review while deciding on which stock to trade, may include end-of-month as one of their factors. If the day to enter the position was potentially the end of the month, then this would increase the number of factors that showed as favorable. Doing so could help a person make more end-of-month trades.
- ONLY enter stocks during the last week of the month:
We’ve purposely limited these entry signals and tactics to those that can also be used in conjunction with the ones you’ll learn in class.

Market Filters
We’ve all heard the market is random and most believe the odds of a winning are only 50/50. However, even in its randomness the market will still experience winning and losing streaks. Just making the small changes we’ve already discussed, gives you a simple way to increase your trading edge and the likelihood of having longer winning streaks with fewer losing trades expected for your natural trading style.
Our next section will describe three additional ways to increase your odds of profitability by keeping you out of the market during times of increased risk. Those who are successful in the markets know how to manage their risk. They use a “when in doubt, sit it out” philosophy to preserve their gains and limit their losses.

The market filters shown in this section of the lesson are general enough to work with many systems and are a great way for you to start analyzing the markets in a more professional way.
Our goal in presenting these three additional market filters is to teach you the concept of using filters to keep you out of bad trades, not to confuse you with conflicting signals.
If you have to choose, start with something you can implement easily first. Then add in additional market filters as your skills improve. Remember, “paralysis by analysis” is a real danger and you can only be successful in the markets if you are actually in the markets and can exit your positions when necessary.
That said, understanding some overarching market dynamics can keep you from getting into trades at the very worst time. Below are three general market filters which you may choose to add to your current system of filters to increase your probabilities of winning.
The three market filters you should be aware of and may want to consider using:
- A Moving Average on the S&P 500
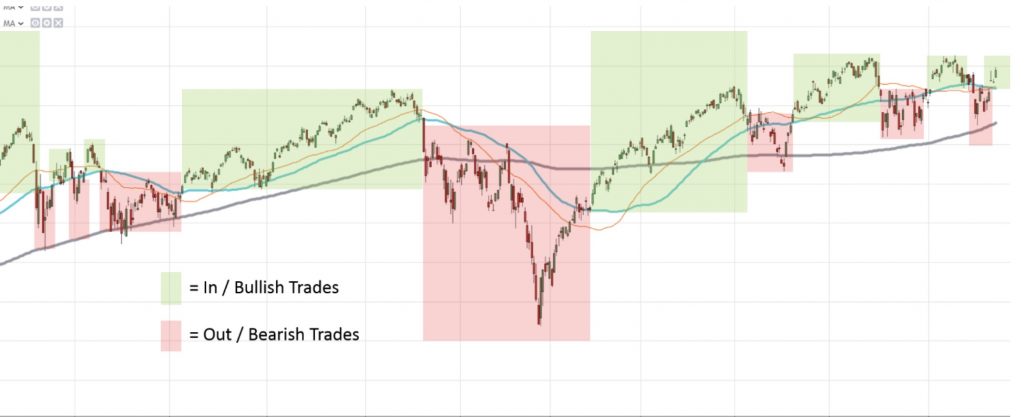
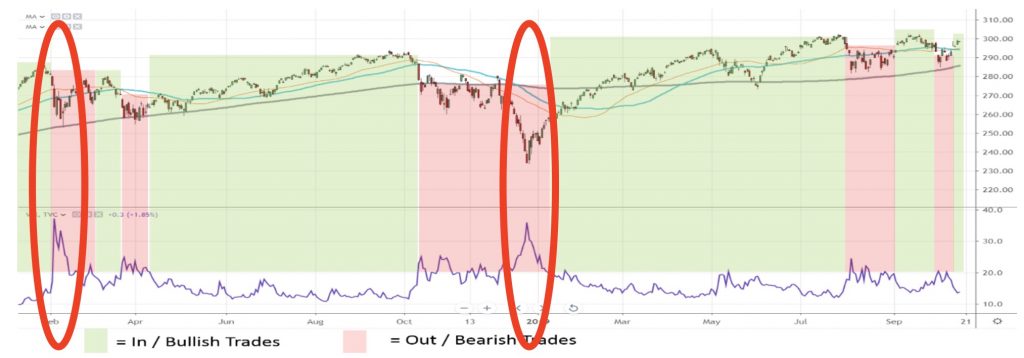
- The level of the Volatility Index (VIX)
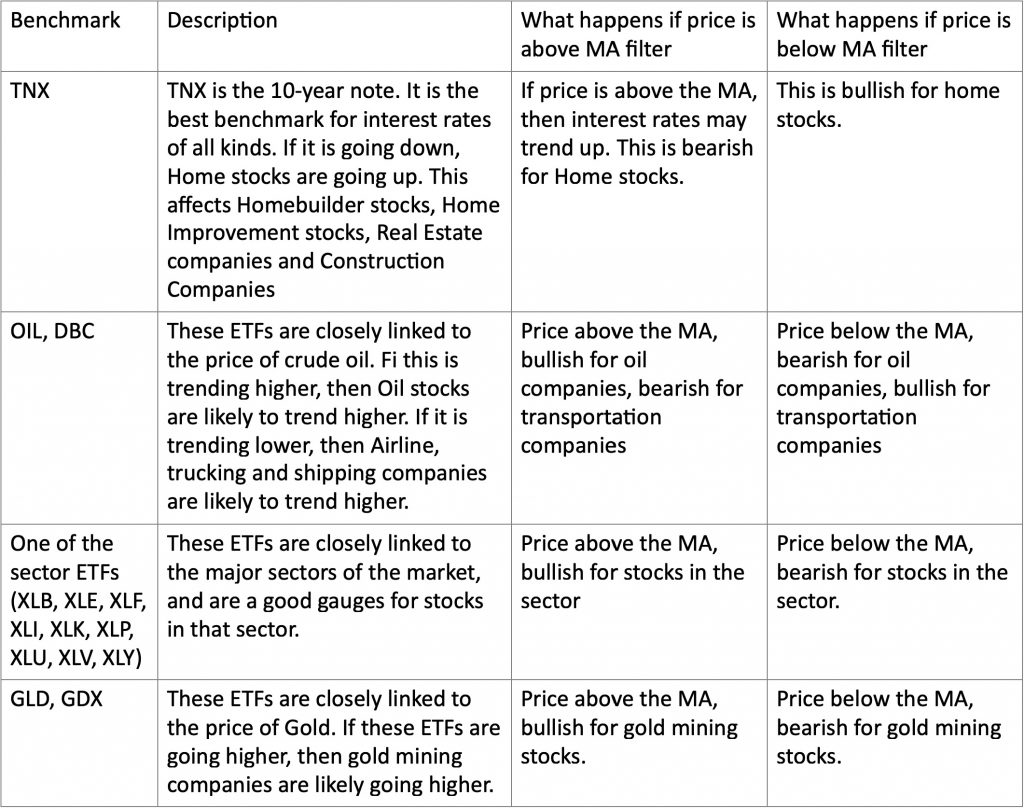
- The trend of a relevant benchmark index
Moving Average On the S&P 500
Applying a moving average to the S&P’s ETF (SPY) is a way to determine if you are generally bullish or bearish. If the price of the SPY is above the moving average you’ve selected, you are bullish and should only do things that make money if things go up. If the price of the SPY is below the moving average, you’re bearish and should only choose strategies and positions that make money when markets fall.
The simplest BULLISH implementation of this filter is:
- If the price of SPY is above an upward trending moving average, then enter new bullish trades.
- If the price of SPY is below an upward trending moving average, then don’t enter any new bullish trades.
The simplest BEARISH implementation of this filter is:
- If the price of SPY is below a downward trending moving average, then enter new bearish trades.
- If the price of SPY is above a downward trending moving average, then don’t enter any new bearish trades until previous direction has been confirmed.
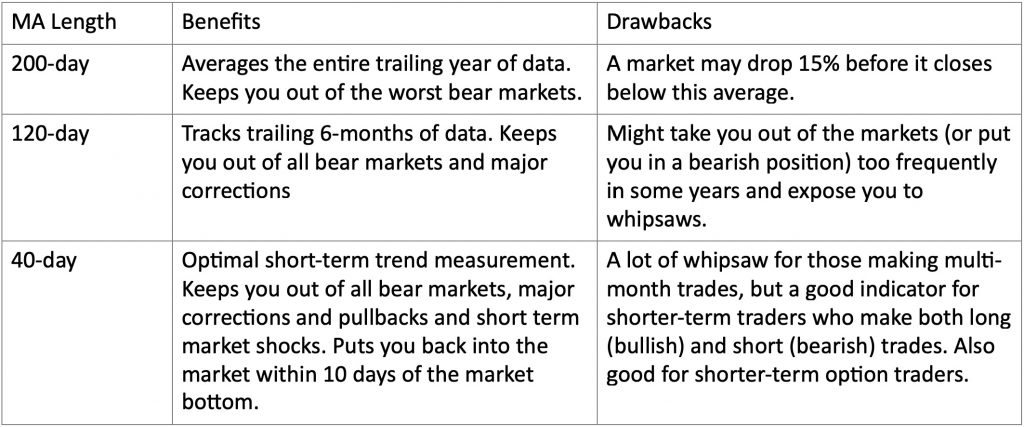
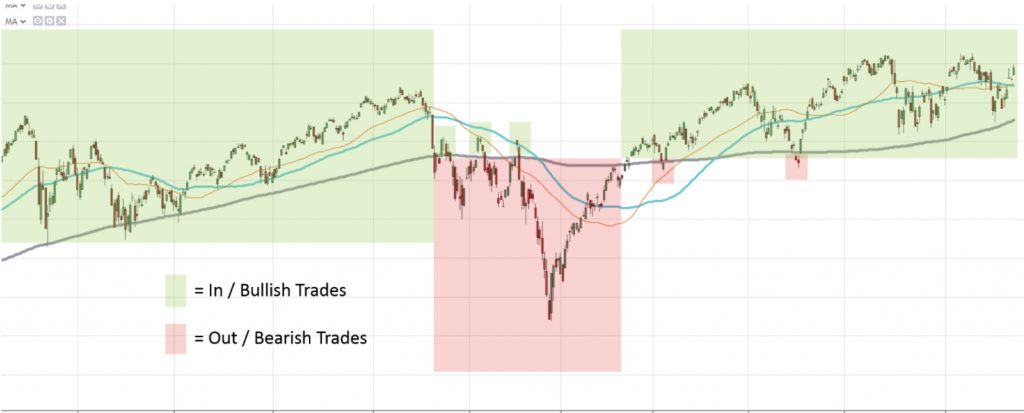
The length of the moving average used determines the sensitivity of the signal. Longer moving averages slow things down, keeping you in trades longer, but sacrificing some profits at both the top and the bottom of a range. Shorter time frames get you in and out closer to market bottoms and tops, but could cause portfolio churn as you get whipsawed into and out of positions unnecessarily. Consider the following examples:

Exit Tactics
One of the best ways to improve your trading is to improve your exit tactics. Never get into a trade using the “buy; then hope, wish and pray for profits” method. Learn to take profits when your system tells you to…and to cut your losses when you system tells you to. Following your system exactly will mean more to your overall success than the wins or losses you take on individual positions.
There are several categories of tactics for exits, but this lesson will generalize just two:
- Adjusting Your Stop – This tactic refers to the way you raise your initial stop loss order. When and how you do this can have a significant impact on your trading.
- Taking the Lid Off – This tactic refers to how you can raise or remove your profit target order (if you are using one). This should be done under special circumstances that will allow you to let your winners run longer.
This part of the lesson will provide an example of these two categories in detail, so you can statistically improve the size of your winning trades and reduce the size of your losses. This will allow you to maximize profits over many trades, increasing your trading edge, and improving your winning percentage above the base win rate of your probability profile.
Your live instruction will discuss these and other methods to help you improve your base win rate and increase your trading edge. Listen carefully in class initially but as you gain confidence, please make positive contributions of your experiences and insights so others can be helped to make their money work harder.
Exit Tactics – Adjusting Your Stop
The purpose of this tactic is to maximize your time in a trend. This tactic can be summed up as follows:
When the stock closes on a new high, raise the stop to a price just below the most recent swing low.
The swing low is the lowest trading point in the most recent 5, 10 or 20 days, depending on the trading time frame you want to optimize. The easiest number of days to use is the lowest low in the last 10 days, but here are the trade offs for all three:
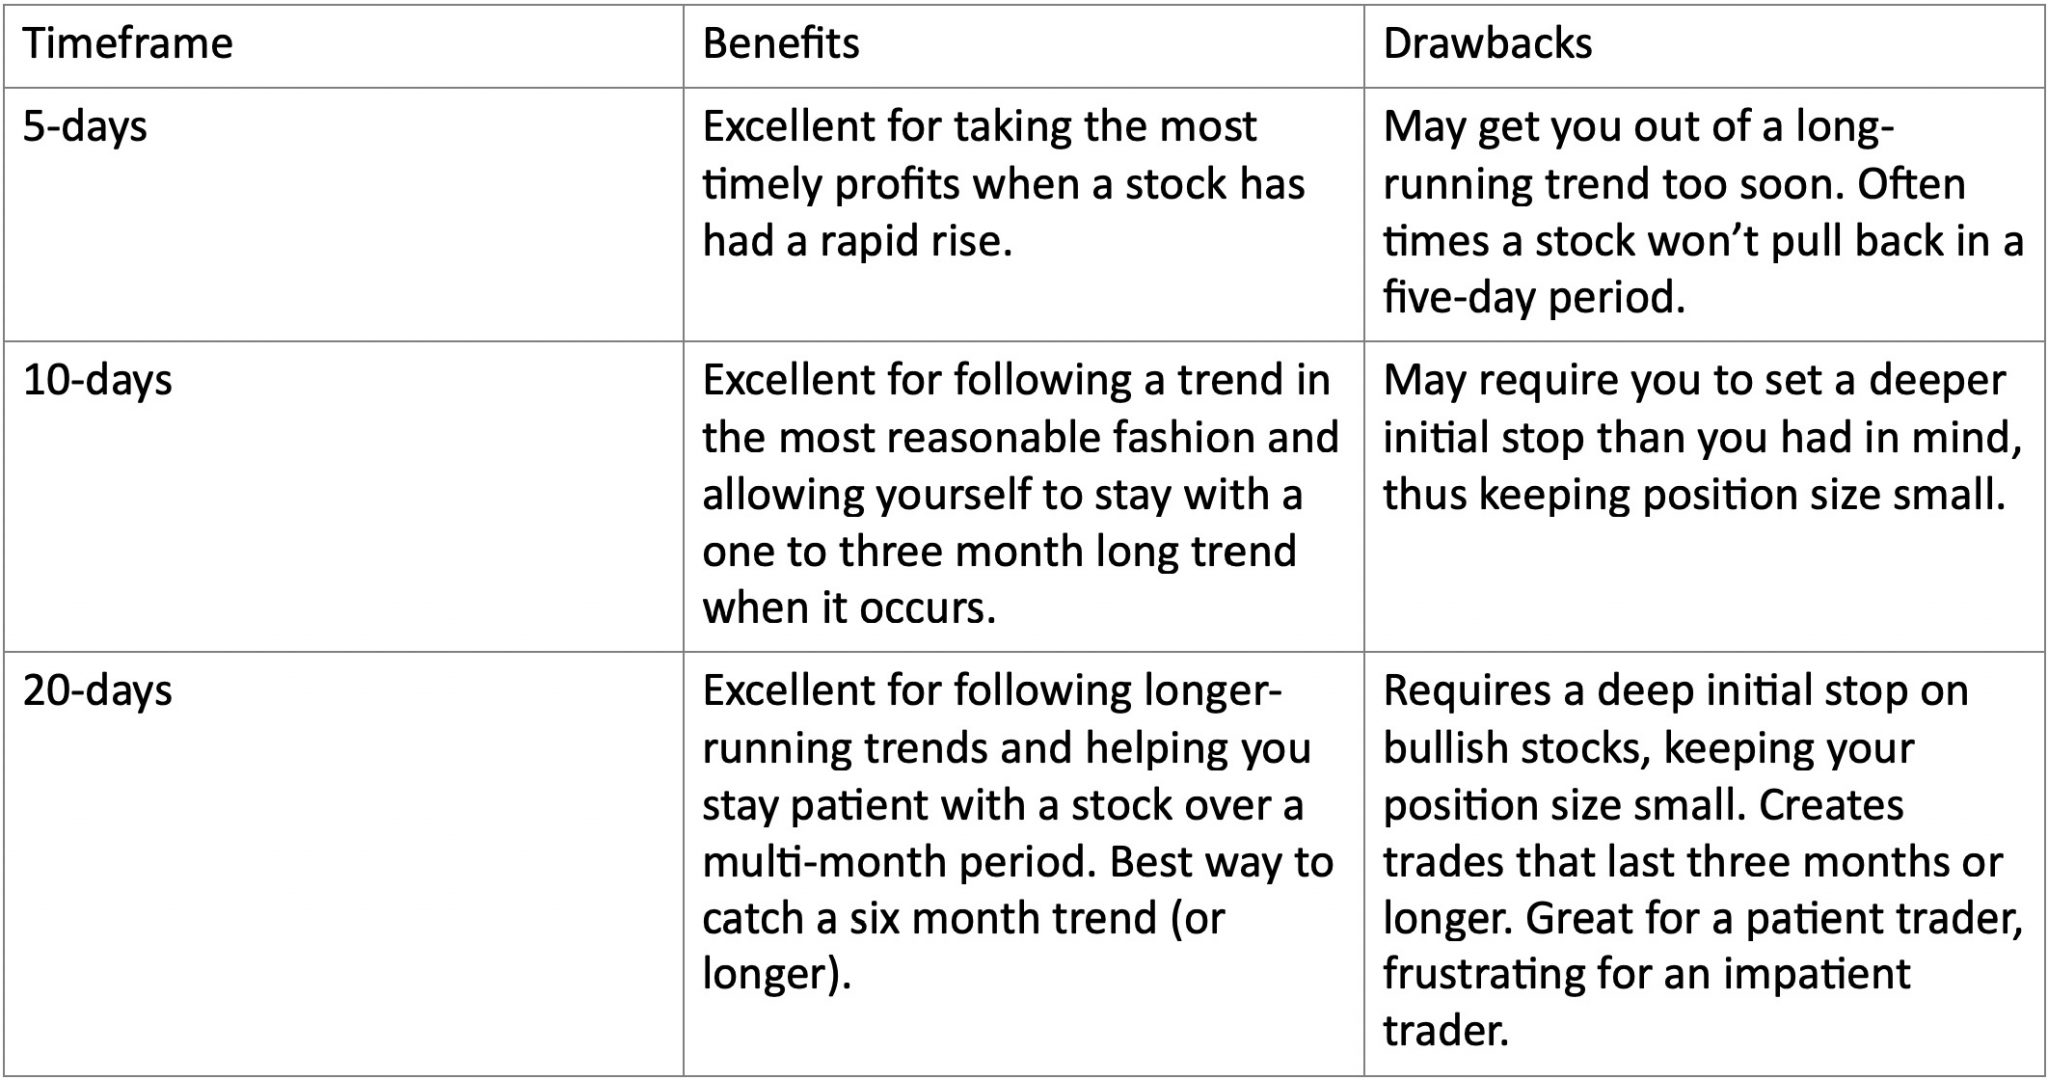
The easiest way to implement these stop order adjustments is to use a chart indicator called a “Price Channel” or “Donchian Channel.” The following is an illustration of each stop level and how it works.
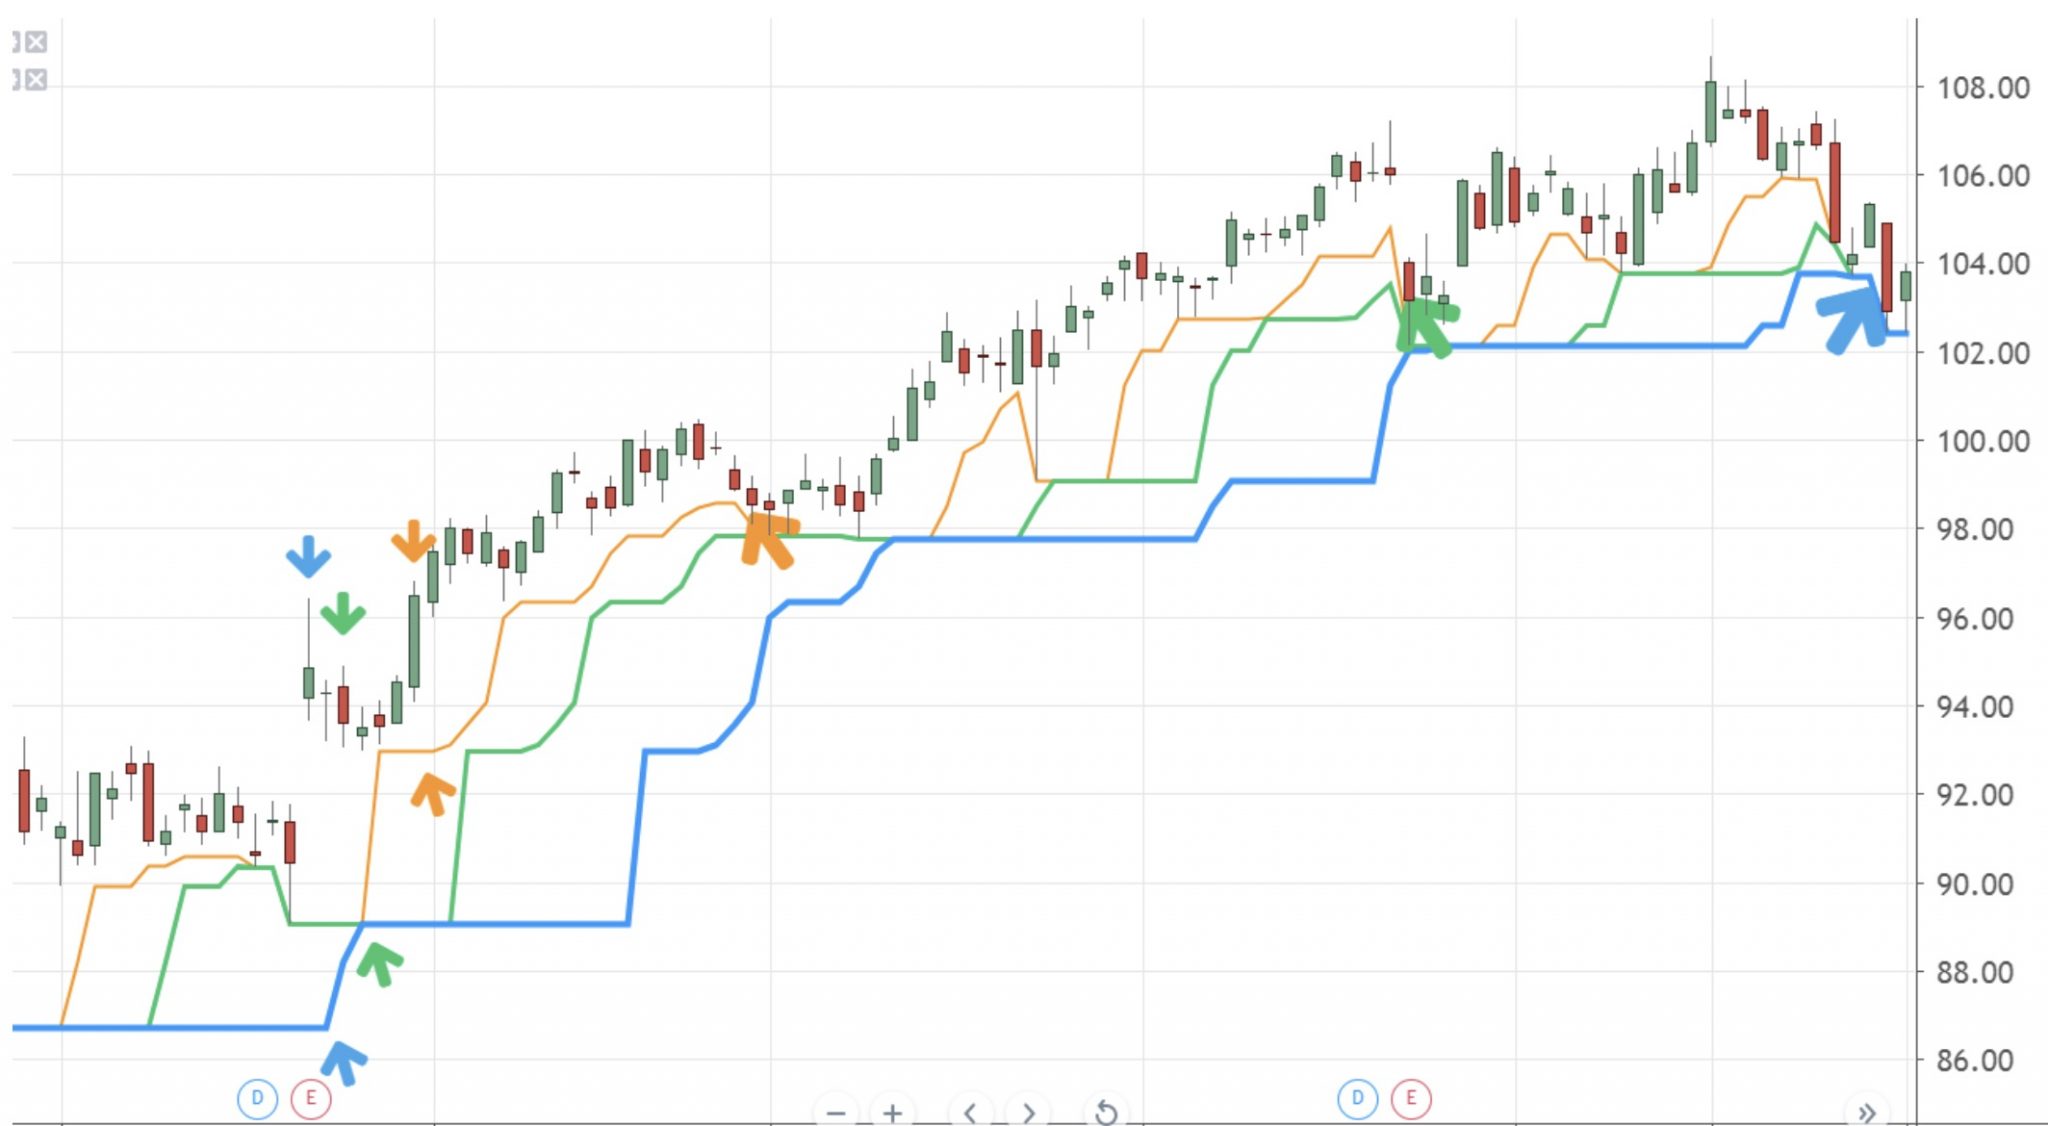
In the figure above, the stock (PG) rose on the first quarter earnings report.
The blue arrows depict a trade setup using an entry and the lowest low in the last 20-days as a trailing stop.
The green arrows depict an entry two days later using the lowest low in the last 10-days as a trailing stop.
The yellow arrows depict an entry four days later using the lowest low in the last 5-days as a trailing stop.
The larger arrows, yellow, green and blue respectively, show how much more profit was earned simply by raising the stop loss to the levels indicated by the Donchian channel for the time specified when entering the trade (5, 10, or 20 days).
If you have questions be sure to ask them in class.
Exit Tactics: Taking the Lid Off
The purpose of this tactic is to allow a select few of your trades to run longer than your rules might normally allow. This tactic is applicable when you use a trading system that includes profit targets and makes use of limit orders to take the profit.
The trick is to recognize conditions when it might be favorable to remove that profit target and let the stock continue to run. Below is a list of steps where “taking the lid off” has proven to be fairly reliable:
- Set up the trade as you would normally.
- If you’re still in the trade 3 days later and your position is profitable, continue to step 3.
- Notice whether your profit target is below a resistance level from the past 20 days, at the resistance, or just above it. If the profit target is at or above resistance and the stock price is currently below that level, then continue to the next step.
- Remove the profit target order (known as a limit order). The stock will either hit your stop loss and get you out, or it will break past your previously set profit target. If the stock continues performing, continue to step 5.
- Replace the profit target order at the price where it was, but this time now as a trailing stop, rather than as a limit order.
- Adjust the trailing stop higher when prices close at new highs. Continue until stopped out.
The following chart shows how this works using a trade on Boeing as an example:
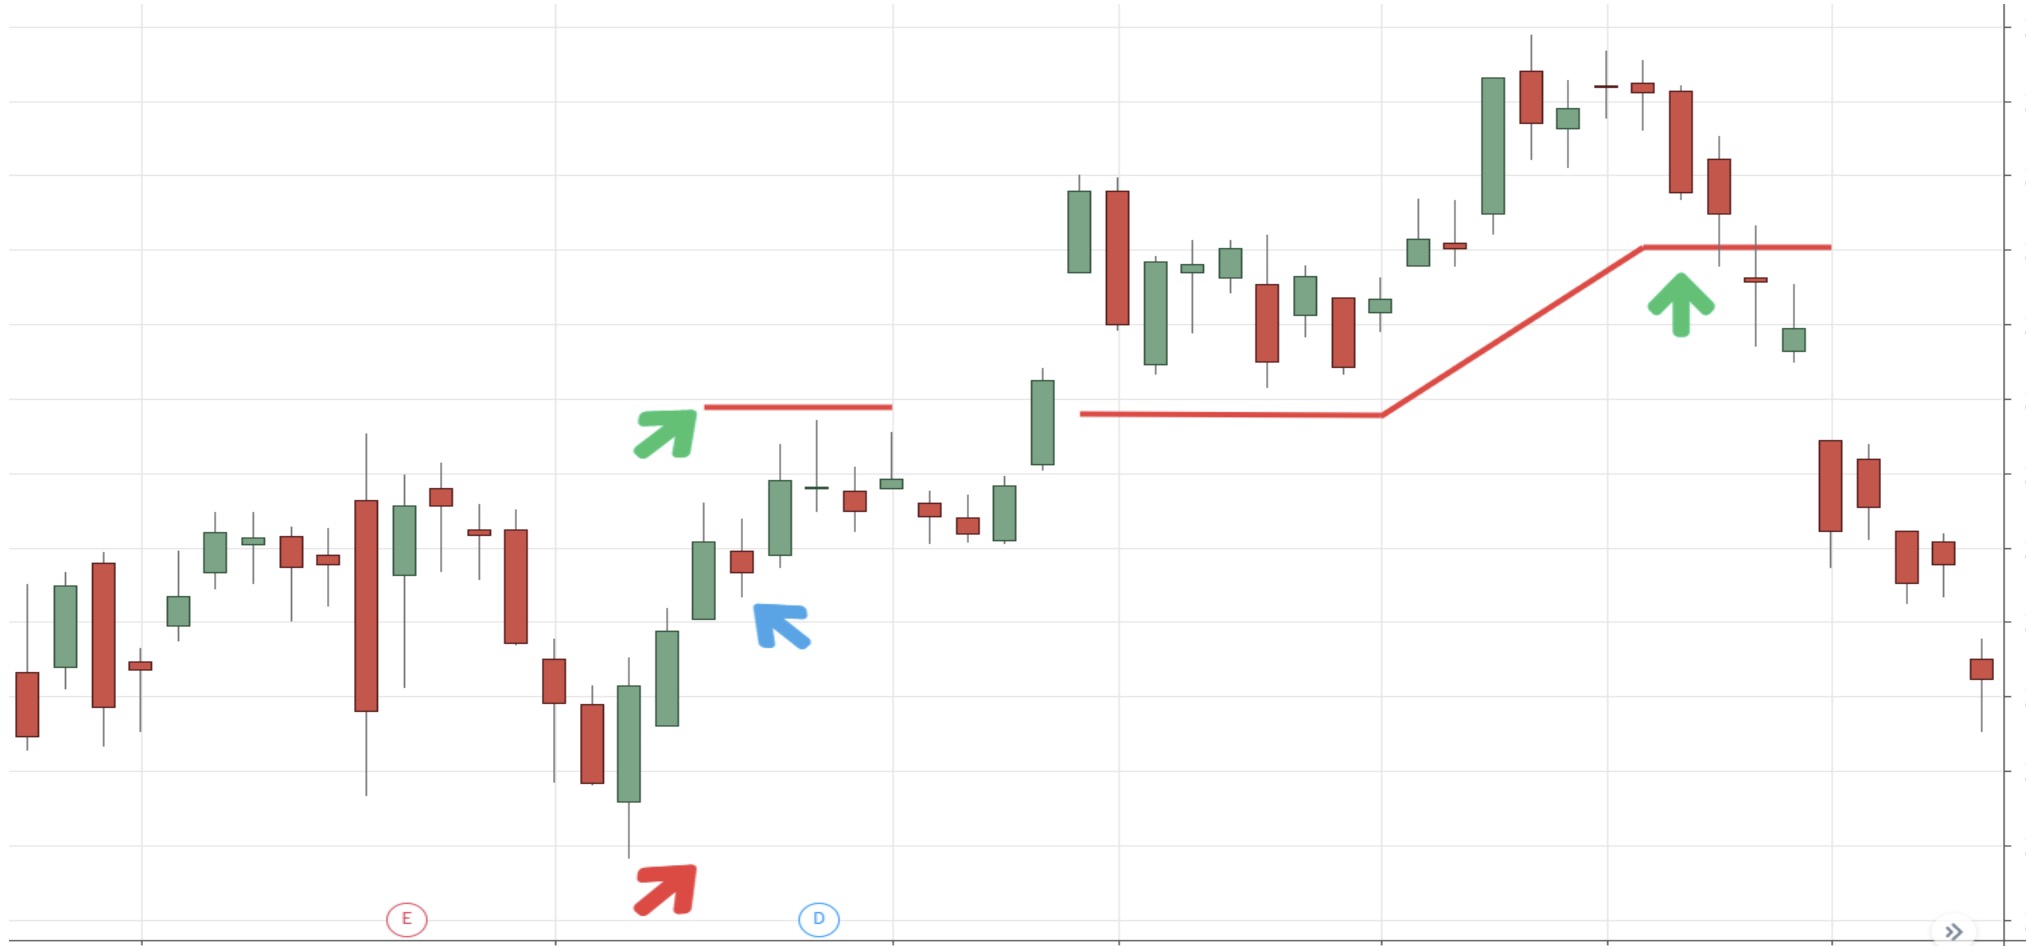
In this figure, an example of a trade on Boeing shows an entry at $340 (blue arrow), with a stop at $320 (red arrow). The profit target is set at $350 (1st green arrow). After three days the trade is profitable, but has not yet reached the target price which is above resistance.
The person removes the profit target limit order and the price breaks higher. The price target is now re-established as a stop and adjusted eventually to $360 where the trade closes (2nd green arrow).
This example is idealized for educational value. Not all trades work out this way. Some come back and hit the original stop loss which can be frustrating.
The odds are in favor of the stock making a breakout before hitting the original stop loss, so it makes sense to attempt this method to improve your results over time and let the trades which follow this example lead to bigger winners.
GAINING YOUR TRADING EDGE – Summary
Success in the markets is all about having a system that consistently works and having enough confidence in it to work it consistently. Taking the expected gains from the Natural Trading Style that fits you best and adding these simple tactics will help you improve upon the base wining percentage you can expect; giving you a trading edge.
Adding in additional tactics and strategies we’ll teach in other lessons and in your live classes can further increase your trading edge and help you make your money work even harder for you.
Approaching the markets in this structured fashion makes it easier to discover additional ways to improve your results as you analyze your trades.
Following a system for getting into and out of your trades instead of just throwing money at the markets in a gambler style approach allows you to discover new ways to improve your results.
As you begin to implement these and other strategies, we urge you to remember that not every trade you make will be profitable. No system wins every time.
Your success or failure is not determined by your profits or losses on any one position but on the cumulative wins and losses you experience over time.
Even Warren Buffet has losing positions or stocks that have come down off their recent highs. The markets don’t go up every day. So protect yourself from losses by exercising your stops, improve upon your base winning percentage by implementing some additional strategies and tactics, and let your profits run whenever possible.
Learning to follow the system you’ve chosen with exactness can definitely improve your trading results. Layering in additional tactics like those we’ve discussed in this lesson will give you additional statistical trading edge and greatly increase profitability over time.
Getting better at entries, exits and using market filters will give you additional ways to make your money work smarter and harder.
Once you have reviewed these and the other tactics of your system, begin thinking about (and maybe start writing down) elements you want to include in your trading plan.