
Performing a Top Down Analysis
As an asset class, the stock market is singular because it is the only one where a trader may be able to mimic the strategic approach of professionally managed funds through the use of ETFs. By using sector and industry group ETFs as a research tool a trader may gain a significant edge. This is known as top down analysis. Because this data is so prevalent, this research can be done quickly and easily from the comfort of one’s home.
In top down analysis, the trader first tries to get a sense of the macro picture and what is going on in the world. This is done through the use of asset class ETFs which are already in your Trade Tool. They can be found by clicking “Watch” to open up the watchlist area, and then clicking on a drop down menu in the upper left corner of your screen. This open up a selection box. Under the third column, look for “System” and then click on 1. Economic Cycles.
Use the ETFs in the Economic Cycles watchlist to see which asset classes and sectors seem to be positioned for big gains during the current phase of the business and economic cycles. These cycles move in a loosely related way and it’s always possible to find upward trending equities to trade during all phases of both cycles. This will be explained in more detail in other lessons.

Once a trader has made a decision about which asset class and sector to trade, they then look at which stocks are doing well and focus on the opportunities presented by these companies. This research is easily done in your Trade Tool watchlist by selecting 2. Business Cycles to see the 11 sectors of the S&P 500. Once a sector has been selected, a trader can then select any of the 11 sector ETFs in their watchlist to see the top 10 largest companies by market cap in each sector.
This approach to top down analysis is quick and easy, but it is limited to the top ten largest companies in each sector. For those interested in trading smaller, more volatile stock asset classes or less expensive stocks within these sectors, top down analysis can be done on the home page of the Trade Tool. See the video below:
Top down analysis is an approach used by the largest, professionally managed funds who seek to know which stocks are likely to do well as investment capital flows in response to cycle changes. Comparing ETFs is an inexpensive, simple, and quick (though less precise) way of tracking money flow through business and economic cycles.
One word of caution: It may be tempting to look at the performance of individual ETFs, asset classes, or stocks, through the lens of absolute performance relative to itself. Yet, a better measurement is relative performance or how well it’s doing compared to other, similar equites. Knowing which sector or stock is growing rapidly compared to other sectors or stocks is a way to obtain a trading edge and find trades likely to do well.
Like all things market related, top down analysis is only to be used as a guide for discovering good trade ideas with a potential edge, it is not a guarantee that the money flow will continue or that entry points will be optimal. That said, hopefully you’ve begun to realize that optimal entry points are less important than once considered.
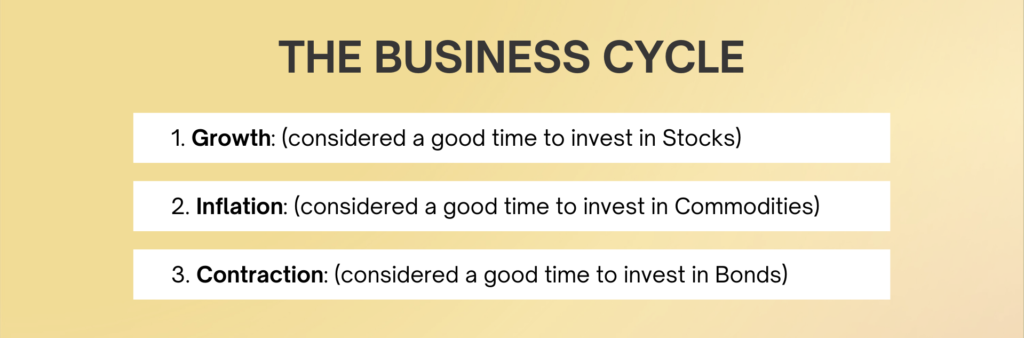
For review, the three main phases of the economic and business cycle are:
- Growth: Stocks, XLY, XLF, XLK, XLI
- Inflationary: Commodities, XLB, XLE, XLRE, XLC
- Contraction: Bonds, XLP, XLV, XLU
As you evaluate economic and business cycles, remember that these are an inexact representation of actual money flow. Also remember that the correlation between business and economic cycles is only a loose approximation that the business cycle might lag the economic cycles by a few weeks to a few months.
Any chart showing the relationship of economic and business cycles and depicting the ETFs in their proper place in the cycle are only an approximation and there will be some overlap in the real world.
In other words, cycles are not gears tied directly to the performance of each other and it’s possible for all of these things to move in lockstep during various points in time.
Only use a three month chart to review the relative performance and strength of ETFs and stocks. Look for changes in direction or a breakout of a channel during this analysis to guide trading decisions.
The buying pressure caused by large, professionally managed funds shifting their focus from one area to another will have an effect on prices and will cause prices to generally rise. One word of caution: Generally rising prices may not accurately reflect changes in the cycle itself. What this means is the during all periods of a cycle, individual trading days may be up or down. Even during the downward part of a cycle, individual equities may have a period of a few up days in a row. Cycles are like the seasons of the year, whereas, trends and channels are more like the weather.

The watchlist created to track asset classes and sectors should therefore be considered a guide showing where large investments are moving, not a guarantee of profits. An investor should remain cautious, especially at the beginning of a shift in the cycle’s pattern.
Once an investor is fully confident that buying pressure will continue into that asset class or sector, they can apply their chosen investment strategy and investing time horizon, confident that macro economic factors will cause a continuation of the prevailing trend…at least for a period of time.
No phase of the cycle lasts forever. There will come a time when things change and larger investment dollars move on to the next big opportunity. As an individual investor, it’s important to remain vigilant and ready to change into other asset classes or sectors with the changing of the tide.
Creating a watchlist of ETFs that track asset class and sector performance does more than help a trader find potential opportunities. It gives them confidence to cut through the ongoing and contradictory noise coming from overly sensationalized news narratives which only cause confusion and poor investing. Keeping a close eye on this watchlist will give the trader confidence in in their approach because they know it is focused on those parts of the economy doing well. They will also have a good sense of the overall market and will be more nimble when changes need to be made. Taking the time to understand the concepts, create the watchlist, and follow the money is a powerful, yet simple way to gain a trading edge and approach each trade in a consistent and repeatable way.