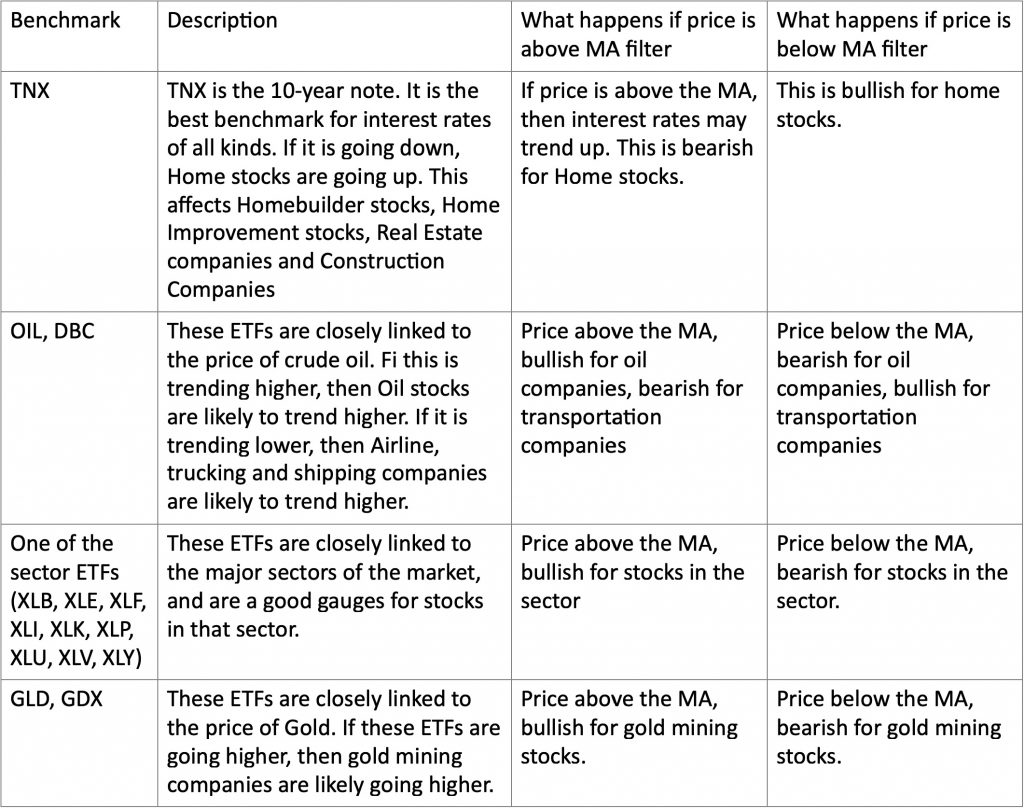
Market Filters
Market Filters
We’ve all heard the market is random and the odds of winning are only 50/50. However, even in its randomness the market will still experience winning and losing streaks. Just making the small changes we’ve already discussed, gives you a simple way to increase your trading edge and the likelihood of having longer winning streaks with fewer losing trades expected for your natural trading style.
Our next section will describe three additional ways to increase your odds of profitability by keeping you out of the market during times of increased risk. Those who are successful in the markets know how to manage their risk. They use a “when in doubt, sit it out” philosophy to preserve their gains and limit their losses.
The market filters we show in this section of the lesson are general enough to work with many systems and are a great way for you to start analyzing the markets in a more professional way. Our goal in presenting these three additional market filters is to teach you the concept of using filters to keep you out of bad trades, not to confuse you with conflicting signals. If you have to choose, start with something you can implement easily first. Then add in additional market filters as your skills improve. Remember, “paralysis by analysis” is a real danger and you can only be successful in the markets if you are actually in the markets and can exit your positions when necessary.
That said, understanding some overarching market dynamics can keep you from getting into trades at the very worst time. Below are three general market filters which you may choose to add to your current system of filters to increase your probabilities of winning.
The three market filters you should be aware of and may want to consider using:
- A Moving Average on the S&P 500
- The level of the Volatility Index (VIX)
- The trend of a relevant benchmark index.
MARKET FILTERS – Moving Average on the S&P 500
Applying a moving average to the S&P’s ETF (SPY) is a way to determine if you are bullish or bearish the market. If the price of the SPY is above the moving average you’ve selected, you are bullish and should only do things that make money if things go up. If the price of the SPY is below the moving average, you’re bearish and should only choose strategies and positions that make money when markets fall.
The simplest BULLISH implementation of this filter is:
- If the price of SPY is above an upward trending moving average, then enter new bullish trades.
- If the price of SPY is below an upward trending moving average, then don’t enter any new bullish trades.
The simplest BEARISH implementation of this filter is:
- If the price of SPY is below a downward trending moving average, then enter new bearish trades.
- If the price of SPY is above a downward trending moving average, then don’t enter any new bearish trades until previous direction has been confirmed.
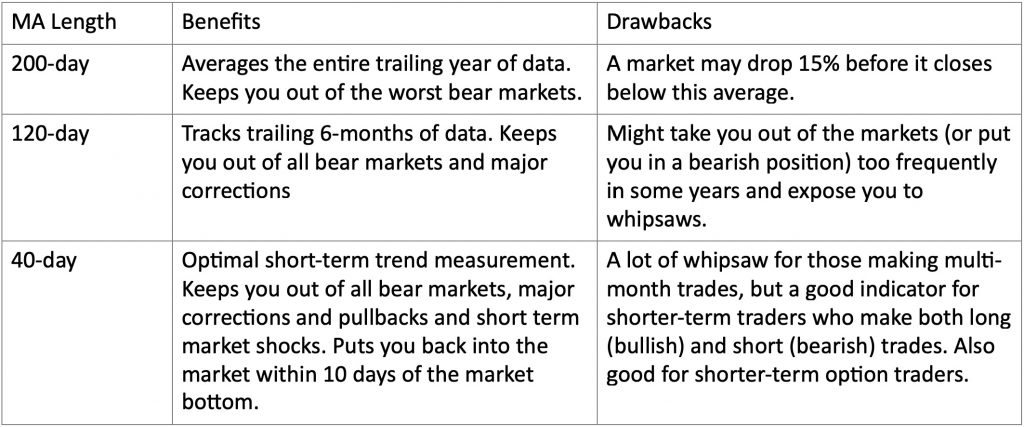
The length of the moving average used determines the sensitivity of the signal. Longer moving averages slow things down, keeping you in trades longer but sacrificing some profits at both the top and the bottom of a range. Shorter time frames get you in and out closer to market bottoms and tops but could cause portfolio churn as you get whipsawed into and out of positions unnecessarily. Consider the following examples:
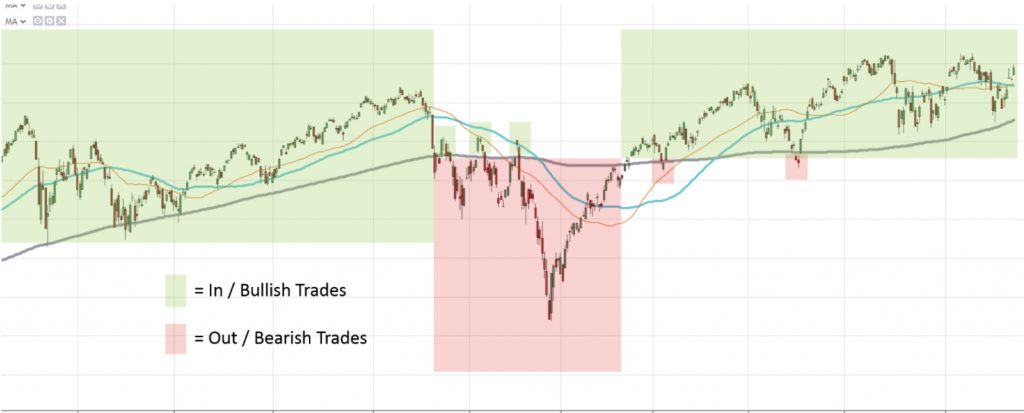
Market Filters – Moving Average on the S&P 500 – Illustration
The daily chart of the S&P shown below illustrates how this filter could be implemented with a 200-day moving average. The 200-day moving average is the gray line. You can see that this implementation helps keep you out of the worst market conditions.
The next figure shows how this filter could be implemented with a 120-day moving average for the same time frame. The 120-day moving average is the blue line. Here you will see that this implementation helps keep you out of the worst and the choppiest market conditions, but requires more vigilance to follow because it changes more frequently than the 200 SMA. It also gets you in a little closer to the bottoms and gets you out a little closer to the tops.
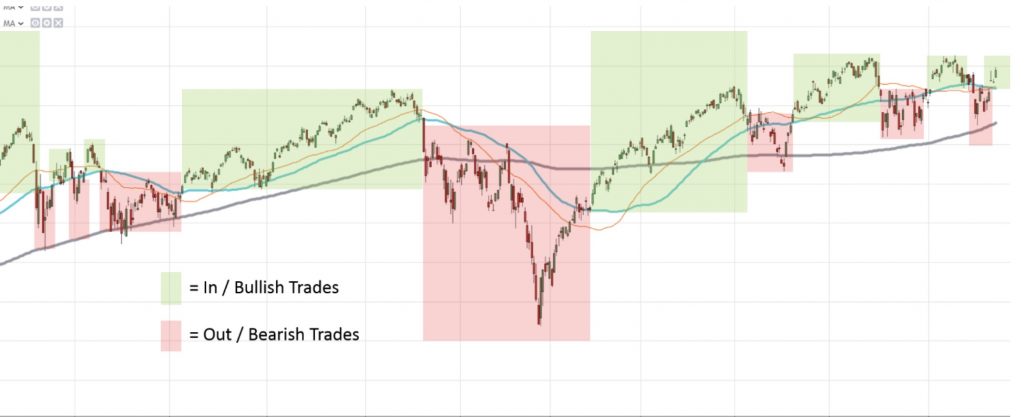
Finally, see how an even shorter time period like the 40 day SMA (shown as the orange line) gets you in even closer to the bottoms and out closer to the tops compared to either the 120 SMA or the 200 SMA. Using this shorter indicator significantly increases the number of trades made and shortens the duration of each trade. It requires even more vigilance to follow because it changes the most frequently of the three moving averages shown. The temptation many traders face is to continually shorten the time frame of their moving average to capture more of a move. One way to avoid this temptation is the repeat a market truism: Pigs get fat….hogs get slaughtered.

Market Filters – Level of the Volatility Index (VIX)
VIX is the ticker symbol for the volatility index managed and published by the Chicago Board of Options Exchange (CBOE). In simple terms, it is a measurement of fear and greed. If fear rises, the prices of the options on the SPX used to hedge positions rises and the VIX goes up in price. If greed increases, these hedge options get cheaper (less demand) and the VIX falls in value.
Historically, VIX moves above a level of 20 signals rising fear and more volatility which could lead to quick downward price action. Not trading when the VIX is above 20 has a similar effect to the Moving Average filter. The way to implement this market filter is to check the VIX closing price for the day and alter the trading rules used depending on whether the VIX is above or below 20.
The simplest implementation is a trading filter such as the following:
- If the price of VIX is below 20, enter new bullish positions.
- If the price of VIX is above 20, then don’t enter any new positions.
The variation on this to implement a directional filter is as follows:
- If the price of VIX is below 20, enter new bullish positions.
- If the price of VIX is above 20, enter new bearish positions.
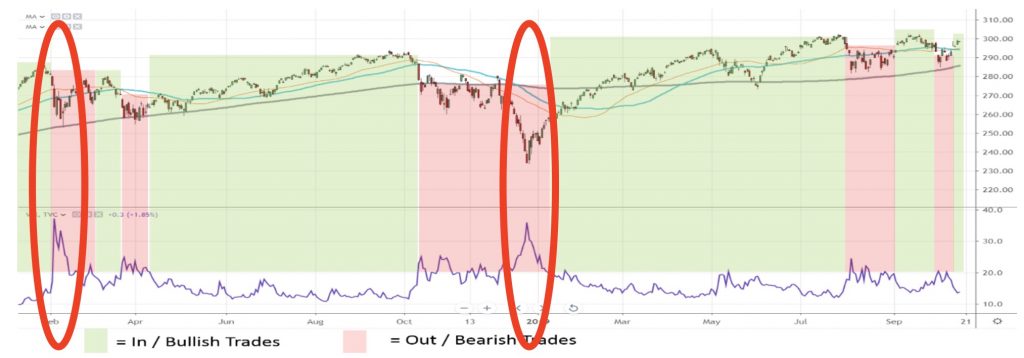
The figure below shows the VIX in purple at the bottom of the chart. See how it mirrors the movement of the market. Some people use the VIX as a contrarian indicator and consider buying on unusually high spikes in the VIX (circled in red on the chart). They believe in that when the VIX is high, it’s time to buy.
Market Filters – Moving Average on a Relevant Benchmark
Applying a moving average with the same timeframe as your system to relevant benchmarks is a simple way to know if the sentiment for that sector is bullish or bearish. Also news, earnings or other announcement from one company may also affect the stock prices of other companies in that industry group.
If prices are above an upward trending moving average, sentiment is bullish and if the average is downward trending and prices are below it, sentiment is bearish for that sector or industry group and therefore for your stocks. It’s possible to compare your stock to multiple benchmarks, though we recommend no more than 3 to avoid confusion and paralysis by analysis.
Here is a list of benchmark stocks and indexes that you might consider using as an overarching filter: