
Exit Tactics
Exit Tactics
One of the best ways to improve your trading is to improve your exit tactics. Never get into a trade using the “buy; then hope, wish and pray for profits” method. Learn to take profits when your system tells you to…and to cut your losses when you system tells you to. Following your system exactly will mean more to your overall success than the wins or losses you take on individual positions.
There are several categories of tactics for exits, but this lesson will generalize just two:
- Adjusting Your Stop – This tactic refers to the way you raise your initial stop loss order. When and how you do this can have a significant impact on your trading.
- Taking the Lid Off – This tactic refers to how you can raise or remove your profit target order (if you are using one). This should be done under special circumstances that will allow you to let your winners run longer.
This part of the lesson will provide an example of these two categories in detail, so you can statistically improve the size of your winning trades and reduce the size of your losses. This will allow you to maximize profits over many trades, increasing your trading edge, and improving your winning percentage above the base win rate of your probability profile. Your live instruction will discuss these and other methods to help you improve your base win rate and increase your trading edge. Listen carefully in class initially but as you gain confidence, please make positive contributions of your experiences and insights so others can be helped to make their money work harder.
Exit Tactics – Adjusting Your Stop
The purpose of this tactic is to maximize your time in a trend. This tactic can be summed up as follows:
When the stock closes on a new high, raise the stop to a price just below the most recent swing low.
The swing low is the lowest trading point in the most recent 5, 10 or 20 days, depending on the trading time frame you want to optimize. The easiest number of days to use is the lowest low in the last 10 days, but here are the trade offs for all three:
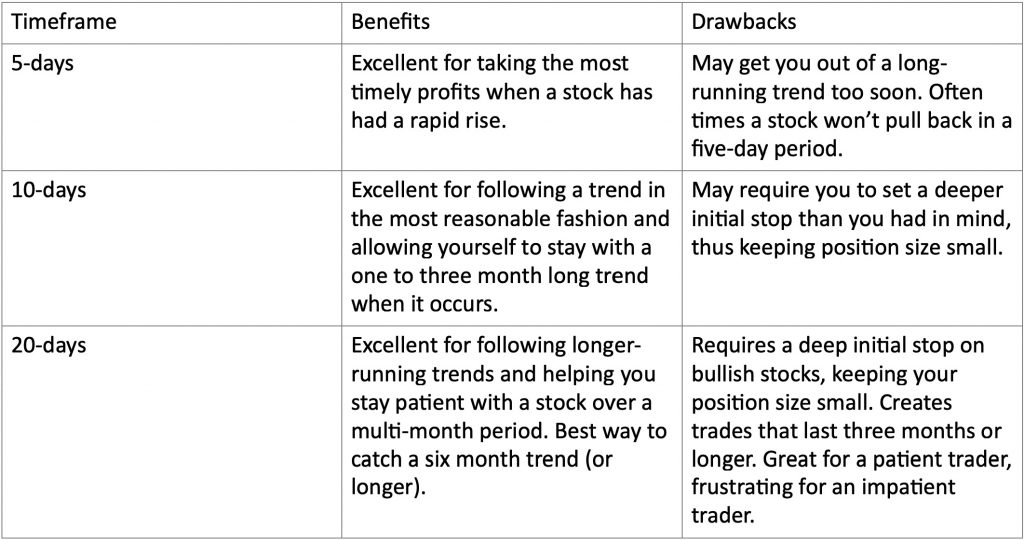
The easiest way to implement these stop order adjustments is to use a chart indicator called a “Price Channel” or “Donchian Channel.” The following is an illustration of each stop level and how it works.
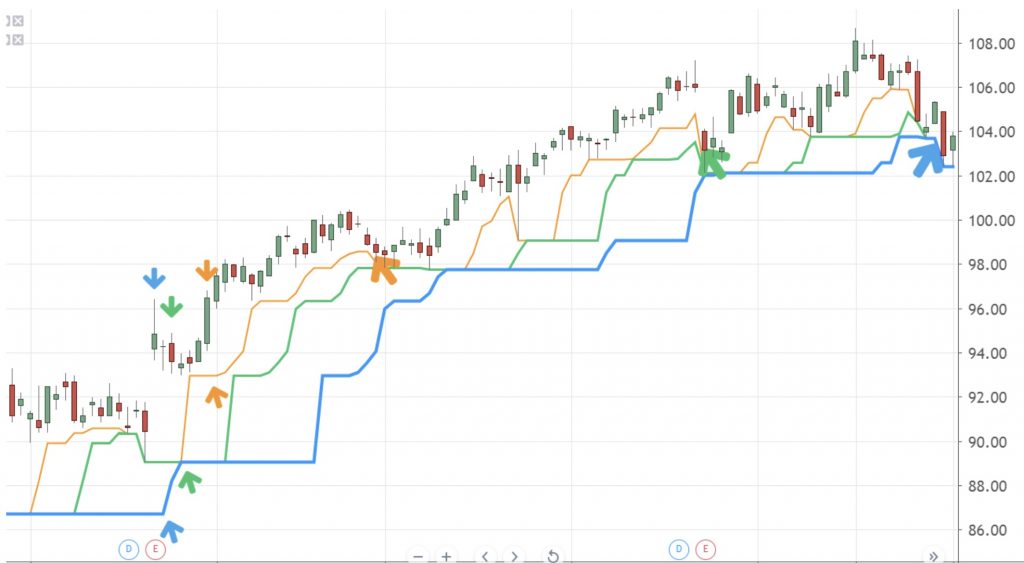
In the figure above, the stock (PG) rose on the first quarter earnings report. The blue arrows depict a trade setup using an entry and the lowest low in the last 20-days as a trailing stop. The green arrows depict an entry two days later using the lowest low in the last 10-days as a trailing stop. The yellow arrows depict an entry four days later using the lowest low in the last 5-days as a trailing stop. The larger arrows, yellow, green and blue respectively, show how much more profit was earned simply by raising the stop loss to the levels indicated by the Donchian channel for the time specified when entering the trade (5, 10, or 20 days).
If you have questions be sure to ask them in class.
Exit Tactics: Taking the Lid Off
The purpose of this tactic is to allow a select few of your trades to run longer than your rules might normally allow. This tactic is applicable when you use a trading system that includes profit targets and makes use of limit orders to take the profit. The trick is to recognize conditions when it might be favorable to remove that profit target and let the stock continue to run. Below is a list of steps where “taking the lid off” has proven to be fairly reliable:
- Set up the trade as you would normally.
- If you’re still in the trade 3 days later and your position is profitable, continue to step 3.
- Notice whether your profit target is below a resistance level from the past 20 days, at the resistance, or just above it. If the profit target is at or above resistance and the stock price is currently below that level, then continue to the next step.
- Remove the profit target order (known as a limit order). The stock will either hit your stop loss and get you out, or it will break past your previously set profit target. If the stock continues performing, continue to step 5.
- Replace the profit target order at the price where it was, but this time now as a trailing stop, rather than as a limit order.
- Adjust the trailing stop higher when prices close at new highs. Continue until stopped out.
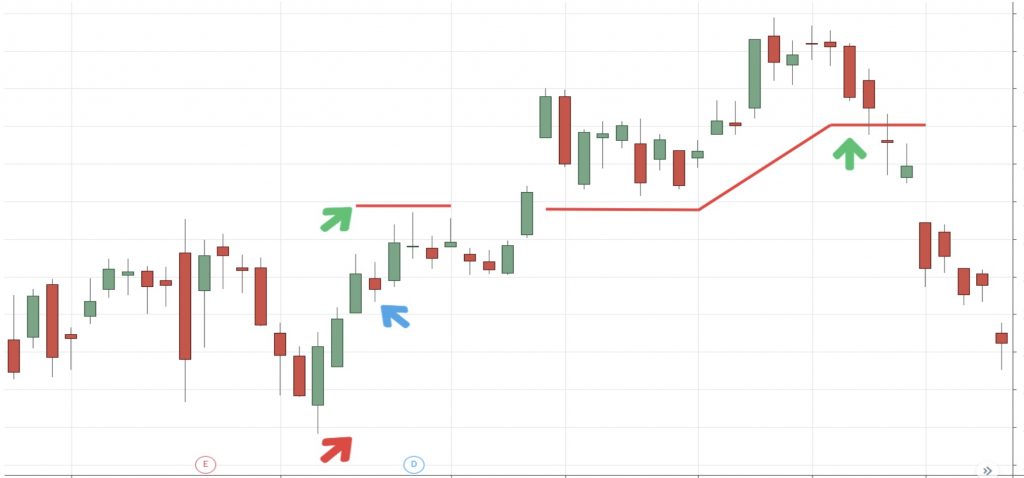
In this figure, an example of a trade on Boeing shows an entry at $340 (blue arrow), with a stop at $320 (red arrow). The profit target is set at $350 (1st green arrow). After three days the trade is profitable, but has not yet reached the target price. The target price is above resistance. The person removes the profit target limit order and the price breaks higher. The price target is now re-established as a stop and adjusted eventually to $360 where the trade closes (2nd green arrow).
This example is idealized for educational value. Not all trades work out this way. Some come back and hit the original stop loss which can be frustrating. The odds are in favor of the stock making a breakout before hitting the original stop loss, so it makes sense to attempt this method to improve your results over time and let the trades which follow this example lead to bigger winners.