Establish Realistic Expectations and Identify Your Tolerance for Risk

Establish Realistic Expectations and Identify Your Tolerance for Risk

Your practice to this point has involved a type of “mental creation.”  During this process you clearly identified your market goals, practiced the approach needed to reach those goals and gained confidence in both your system and in your ability to be successful.  Now it’s time to move from mental creation to creation in the real world.

This step is both natural and necessary, though it can be challenging.  Most of us can’t save our way to retirement and so we depend on putting our money to work harder today to enjoy a better lifestyle tomorrow. But it’s often scary to risk our hard-earned money in a market we can’t control and may barely understand.  This fear, coupled with a natural initial resistance and inertia to doing new things, may derail you before you even get started.  We encourage you to remain committed to your financial goals and hold fast to the confidence you built up while paper trading.  Asking yourself (and deeply thinking about) questions such as those below will help you mentally prepare for the switch to real money.

  • How much can you tolerate losing before feeling compelled to alter your trading activity?
  • What life skills can you bring to the market to help you stay the course?
  • What are the expected winning or losing streaks for your probability profile?
  • What will you do if you run into a series of losing streaks longer or more frequent than you expected?
  • How will you handle unexpected winning streaks?
  • How can you improve your ability to maintain your market discipline in the face of repeated wins or losses?


A struggle many people face in all aspects of their lives is the management of expectations.  Derek Harvey wrote, “Unmet exceptions is the mother of all frustrations.”  So before you start, review the expected rates of return for your probability profile and the system you’ve chosen to follow.  Then understand and set appropriate expectations regarding the winning and losing streaks that will occur when trading within a given probability profile to help keep you centered on your system.  This helps you avoid mistakes caused by greed.

Keep your initial real money market positions small and work to follow the system exactly.  At this point in your journey, it’s all about implementing the system you developed in previous lessons more than any gains or losses on your trades.  Remember, your success is ultimately tied to how well you follow your trade plan.  Focusing more on the things you can control (like following your system exactly) helps you avoid mistakes caused by fear.


Realistic Expectations for Win-Big Profiles

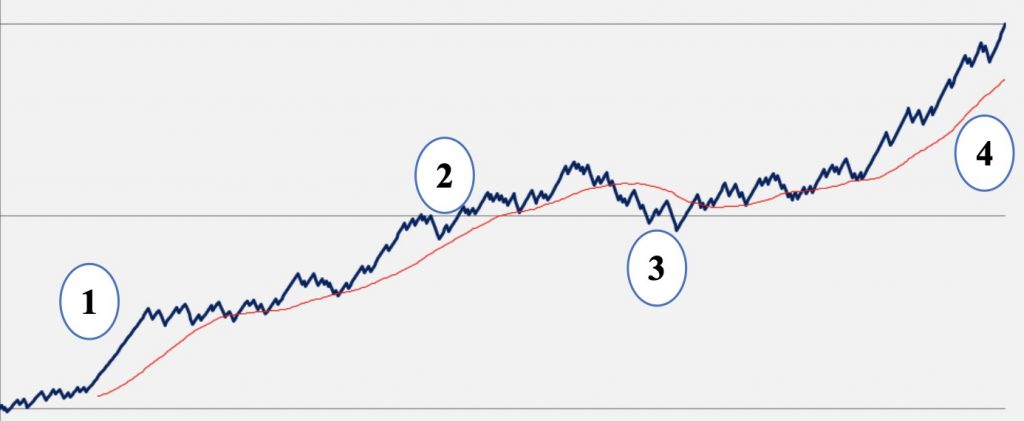
Below is a chart known as an “equity curve” which measures the changes in a trading account balance.  This equity curve chart depicts a series of 500 consecutive trades using the “Win-Big” trading style.  This style generates many small losing trades with a few really big winners.

In this figure, the blue line represents a trading balance after each trade. The red line represents a moving average to those values. Each of the gray horizontal lines in this figure represent a 20% increase from the one below it. There are three important features in this figure: a losing trend, a losing streak, and pronounced winning streak. 

Losing Trend (1-2) 

In any trading system a losing trend can occur. This can be sparked and exacerbated by market conditions that run counter to a trader’s strategy, by errors that the trader unconsciously introduces, or by the random fluctuations of the market.  The threat of multiple losing streaks makes a good case for practicing great money management whenever you enter the market.

Losing Streak (3) 

Win-Big profiles are prone to experience 10 or more consecutive losses. Such a losing streak can be frustrating, especially if some of those losses are larger than expected. The most important defense against a losing streak is to keep risk size equal. Too many traders make the fatal mistake of increasing risk as a losing streak lengthens. But a winning trading system can overcome any losing streak so long as the risk amount is not increased inappropriately.

Winning Streak (4)

Winning streaks are rare in a win-big profile, but they do happen. The most important thing about trading this system is to consistently trade it…allowing one of these streaks to come along. It may take as many as 100 trades before you see such a winning streak, but in win-big style trading, a win streak can actually account for a majority of the gains a trader makes in a month or year. 


Realistic Expectations for Win-Frequent Profiles

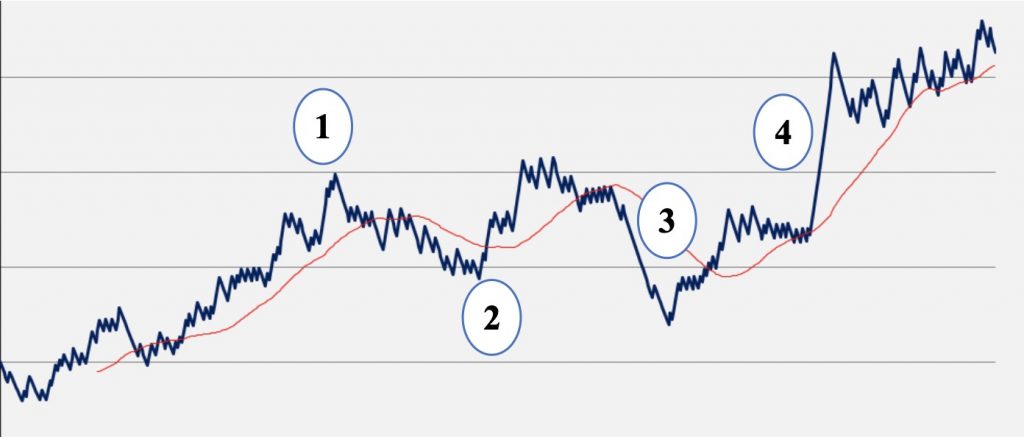
The following figure depicts another set of 500 consecutive random trading outcomes patterned after the win-frequent trading style.  This shape reflects more winning streaks, but also features larger-sized losers than the average size of the winners. The losers are less frequent, but when they occur in close proximity they can create substantial drawdowns in a hurry.

In this figure, the blue line represents a trading balance after each trade. The red line represents a moving average to those values. Each of the gray horizontal lines in this figure represent a 20% increase from the one below it. 

Winning Streak (1) 

The Win-frequent trading style creates more winning streaks than other styles. Streaks of small-sized wins can be anywhere from nine to twelve or more. 

Losing Streak (2)

The Win-frequent trading style wins more frequently but can lose a lot in just a few trades as shown at marker 2.  It took more than seven wins over the course of the next nine trades to make up for the losses experienced in just three trades.   

Prolonged Losing Trend (3)

Losing streaks are less common in a win-frequent profile, but they do happen. When several such short losing streaks occur in close proximity a prolonged losing trend can occur. There is a greater than 50% chance that three losing streaks of four or more trades will occur in close proximity over the course of 500 trades. That is what the activity at marker 3 represents.  Stay the course and be patient during these trends. 

Prolonged Winning Trend (4)

The win-frequent trading style is capable of generating a number of short winning streaks in close proximity. In fact there is a better than 50% chance that a cluster of four winning streaks in fairly close proximity will occur at least once in every one hundred trades.  After a losing streak or losing trend, it is important to remind oneself that winning trends can and do occur in win-frequent trading styles.  You’ll find more consistent success as follow your routine and remain consistent in your approach regardless of the winning or losing streaks you experience.


Establish Your Tolerance for Risk 

Once you have a clear understanding of the potential outcomes in the probability profile that matches your personality, you can begin mentally preparing for them.  It is very important for you to acknowledge and accept your preferred risk tolerance before beginning to trade with real money. Once you have identified your risk tolerance, select effective rules and capture them in your trading plan. Following these rules exactly for the entire trade (entry to exit) will help you limit losses over a number of trades while generating gains in a way that is consistent with the trading system you have selected. This is what it means to have a repeatable system.  

Consider the following questions to help you identify your risk tolerance and select effective risk management rules that are appropriate to include in your trading plan: 

  • What is the frequency of trades you are likely to make in a calendar year?
  • What kind of drawdown you can experience and keep your trading plan unchanged?
  • What is the likely length of losing streaks you will experience in a year?
  • What kind of money does that losing streak represent?
  • What amount of money (as a percentage of your trading account), should you place on each position to so that a losing streak won’t wipe you out or cause you to shift gears?


Frequency of trades:

You can estimate your annual trading frequency based on the number of positions you intend to manage simultaneously and the average length you’ll hold those positions.  Your trading system should help you find both of these numbers.  Use the table below to help you identify your likely annual frequency.

Losing Streak and Probability Review

The table below helps you determine how a max losing streak will financially impact your account.  It works by multiplying the amount you put into each trade by the number in the cell that matches your trading style and trade frequency.  So if you trade the Win Frequently style, risk $1000 on each trade, and make 60-120 trades a year, a losing streak would potentially impact your account negatively $1000 per trade x 6 = $6,0000.


*t/y=trades per year

The next table helps you determine the total drawdown caused by cumulative losses in a trend.  To use this table, multiply the dollar amount you risk on each trade by the number in the cell that matches your trade frequency and trading style.  For example, let’s say you risk $2000 on each trade and you are a Win Big trader making 120-170 trades a year.  Your expected total drawdown caused by a losing streak would be:  $2000 x 15 = $30,000.

While these numbers are not absolutes, they do give you a good idea of losses that could happen in your trading account during the year.  Knowing the likely financial impact of losing streaks and losing trends helps you mentally and emotionally prepare for them so they don’t cause you to make ill considered changes to your system mid-stream or worse, stop trading.


Size of Tolerable Drawdown

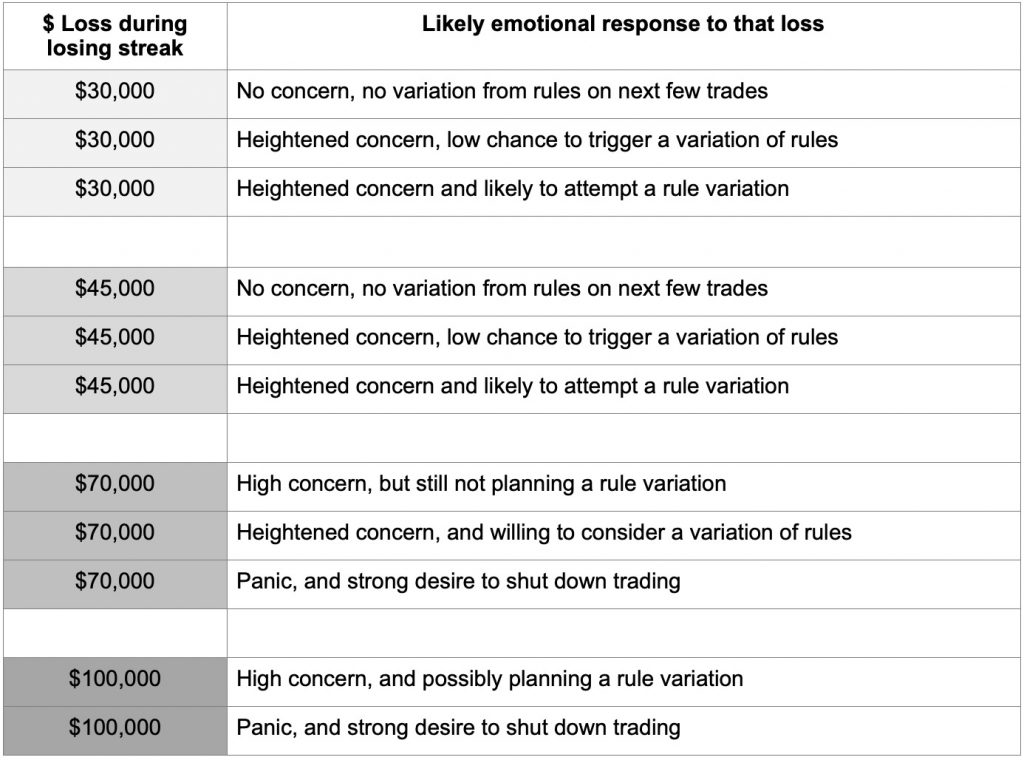
No one likes to lose money. The emotional responses experienced when losing money can whipsaw you away from your system. It’s harder to maintain good market discipline once you lose confidence in or become dissatisfied with your system. The purpose of this mental exercise is to help you reduce the impact of emotional responses which might cause you to ignore your trading rules or to stop following your documented trading plan. To that end, imagine the following scenario, each point in sequence, then use the table below.

    1. To begin, imagine that you have a $260,000 account that took you five years to build.
    2. Now imagine that you grew it to $290,000 within the first three weeks of the month. 
    3. Now imagine that in the 4th week, you had a losing streak of a size listed below.
    4. Now look at the table below and select which $ Loss you had during the losing streak and your emotional reaction to it:

Your emotional response may signal your probability trading style.  Win big traders emotionally respond to losses differently than those who are more naturally geared to a win frequently trading style.  After you have selected the dollar loss and your likely emotional response to that loss, use that information as a reference point for the following table. 


Level of Tolerance

Let’s say you chose “$30,000 and heightened concern and likely to attempt a rule variation” in the previous table.  This would indicate a Win frequent trading style.  Now look at the table below for $30,000 in the “Drawdown Size” column.  As you look at the “% Loss” column you’ll see this loss represents a 10% (or just under) loss on the entire account of $290,000.  Next you’ll see that a 10% drawdown is a below average level of risk tolerance.  This is not a judgement.  It really doesn’t matter what your risk tolerance level is, so long as you know what it is and avoid letting fear whipsaw you out of positions or the market prematurely.

The final column in that row is the “Safety Range” column.  Based on your level of risk tolerance, the safety range helps you determine what dollar amount to risk per trade over your cumulative trades so that losing streaks won’t cause you to change your approach or tweak your system.  Consistency in the amount risked in each trade helps keep your emotions of fear and greed in check.  This consistency also helps you avoid unnecessary loss caused by over allocation to any one position.

It’s also important to avoid letting any loss, especially those in losing streaks or losing trends cause you to change your method of investing.  This is a hard thing for many new market participants to avoid but it’s critical to success.  You have purchased a successful system.  That system won’t be right all the time, but it is designed to be consistently right over time.  Your ability to consistently apply that system when it works and when it doesn’t work is key to your success in the markets.  

The other trap people fall into is changing their system because of profits.  If one or two trades go very well, they may increase the amount they risk on each trade to help their portfolios increase in value more quickly.  This sort of response is just as dangerous as any response to losses.  Stay focused on your system…not results!

Please take some time to really think about your situation and your emotional responses to loss or gains.  If you’ve never traded with real money before, this can be difficult and you may come back to this exercise after having entered your first few real money positions.

Most traders or investors cannot tolerate more than 15% loss to their equity, although this varies greatly from one individual to another. Even one individual’s tolerance can vary depending on life circumstances and how confident they feel.

Remember, losses on any one trade or even over a few trades does not make you a failure and will not affect your long-term profitability in the markets unless you allow yourself to get pulled away from your proven approach.


Optimal Trade Risk

An important part of any trade plan is proper money management which includes the amount you should put into or risk on each position you take.  Knowing both your trade frequency and how a losing streak might affect your account helps you develop a plan you can follow during all market conditions.  It helps guide your decisions for how frequently you want to trade and how much you want to risk on any one position.  It will also help you prepare mentally and emotionally for handling losing streaks more positively as you continue your consistent approach to the markets.

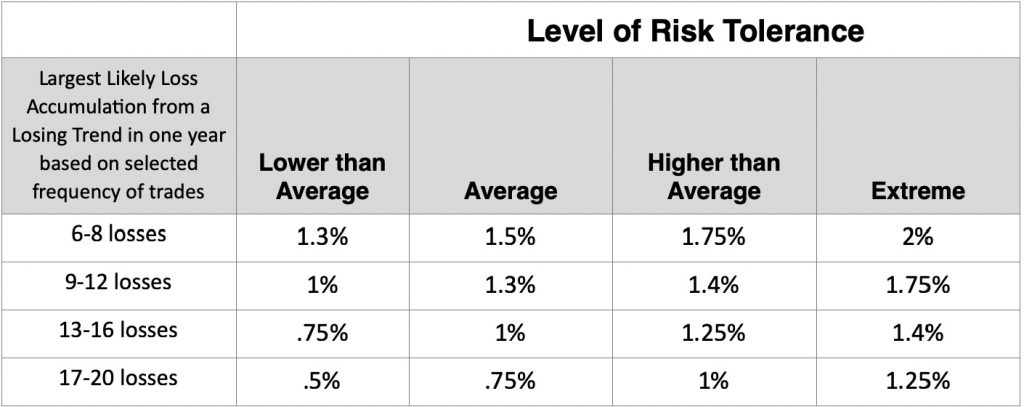
Using the information you determined from previous sections of this lesson, use the table below to determine how much you should invest into any one position.  Information for the example:

  • Your portfolio size:  $150,000
  • Trade Style:  Just Win
  • Trade Frequency:  120 – 170 a year
  • Longest Likely Losing Trend:  12
  • Risk Tolerance:  Average


Now using this information, look at the chart below.  The second row down has 9-12 losses.  Follow that row over to the average risk tolerance of 1.3%.  Use this information to determine the maximum amount you would risk per trade:

$150,000 x 1.3% = $19,500 maximum loss ÷ 12 longest likely losing trend = $1,625 risked per trade.

Now $1,625 is not the amount you would invest in each position, it’s the amount you would risk in each position.  We’ll get into that discussion in the next lesson.  Your system works best when you risk the same amount on every trade.  And you’ll work your system best (through winning and losing streaks) when you understand and fully implement the concepts we’ve shared so far in this lesson.