
Procedures for trading penny stocks
Planning and executing trades
Procedures for trading penny stocks
The first step in planning trades is to identify and prepare to follow a consistent procedure for each trade. This mental preparation is more imperative in the penny stock world, in which approximately two trades out of three are losers.
Because of the high number of expected losing trades, it’s important for a trader to prepare for a larger number of losing streaks. To better estimate the size of a losing streak a trader can expect, we have to make some assumptions. An active trader who makes four trades a week can end up making more than 200 trades in a year.
Over the course of 200 trades, a trader can expect to statistically lose up to 13 trades in a row based on the expected 33% base win rate from this stock category. Losing 13 trades in a row can be very taxing mentally, not to mention what it can do to your trading account.
Traders can limit the amount of loss in a trading account if they control the amount of money they risk on each trade. Among professional traders, a good rule of thumb is to risk no more than 1% of the total trading account on each trade.
It’s tempting to focus on how much money can be made, but a trader is better off focusing on implementing specific procedures for managing risk and capturing asymmetric returns. While this is easier said than done, the reality is a high number of losses in a row can create wild emotional swings which make it difficult to follow any rules, including those for risk management.
One way to avoid this temptation is to liken your efforts as a penny stock trader to venture capitalists. Venture capitalists expect to lose a higher number of their investments. Numerically, they expect to get some profit from about 1 of 3 investments, and that 1 in 10 investments become large winners which pay for all the losses and provide a healthy profit.
The best way for penny stock traders to begin experiencing immediate consistency in their trading results is to set and then follow clear exits. In the case of our example, we placed profit targets that were 2.75 times higher than stop losses relative to the entry.
This chart shows the outcomes of 120 hypothetical penny stock trades. The resulting graph could be thought of as the change in balance of a trader’s account.
These trade outcomes were generated based on two assumptions. First, the trades would win, statistically speaking, only one trade out of three. Second, the winning trades would win 2.75 times more than the risk taken on the losing trades. So if a losing trade lost $100, a winning trade would gain $275 in this simulation. Let’s look closer at the detail and see what we can learn from this.
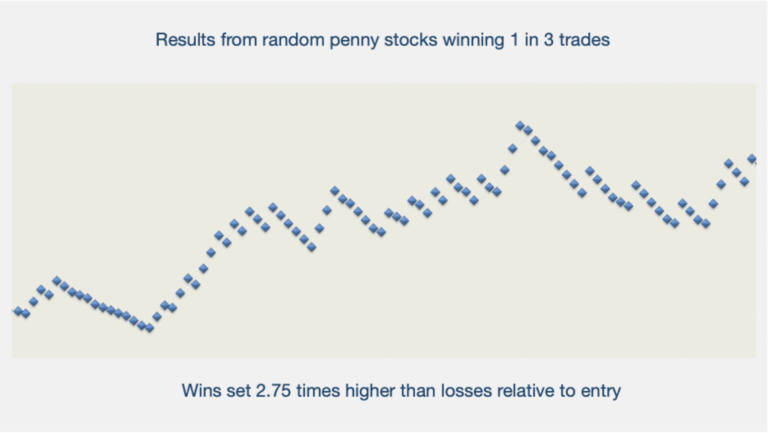
What is immediately apparent is that a trader can expect to have some significant losing streaks. It also appears that losing streaks may tend to be more frequent than winning streaks.
Even though this trading scenario only wins one out of three trades, note that the individual trade outcomes tend to trend upward. This means the account is growing in size over time despite the high number of losses experienced with this method. This happens because the winners are a good bit larger than the losers.
There are a number of things to unpack with this chart, and our next lesson will do just that.
Setting quantifiable risk management strategies
The reality of the penny stock market is that prices move quickly and often radically over just a short period of time. These sudden moves can spark tremendous profits and losses which may create emotionally reactive and poor decisions if a trader is unprepared for them.
The statistical reality is that only one in three penny stock trades will make money. This means a trader must be prepared to lose approximately 67% of their trades. This high number of losers in relation to winners means losing streaks will be longer and more frequent than winning streaks.
Some traders may wonder if it is even possible to be profitable considering these challenges. The answer is undoubtedly yes, but only if the trader is prepared to be consistent in their approach to the markets and persistent enough to keep trading the same way through the losses.
Now let’s look at that chart again:
Notice that towards the end of the chart there are 4 large losing streaks in a row. There were 24 total losers during this period with only 3 winners to break up the losses. These are the kinds of results over many trades that can be expected in the penny stock arena.
For those who haven’t gone through this course and don’t have the expectations you’re learning here, these dismal periods of intense loss, discouragement, fear, and second guessing, the temptation is to throw in the towel and give up as a failure.
If it’s possible for 24 losing trades to happen in a row, then a trader must think seriously about the amount they risk on every trade. Risking 1% per trade means a trader could lose as much as 20% of their portfolio during such a losing streak. Risking 2% could mean a trader loses close to half their account during such a time.
It’s tempting for new traders to get impatient with a 1% limitation because their winners could be so much bigger if they’d only put more money into the position. Yet experienced traders understand how important it is for them to be able to emotionally and financially survive a max drawdown and still follow their system.
Notice the overall direction of the chart. It’s upward trending. This means the account is growing consistently and the only thing a trader needs to do is keep following their rules and keep trading! If the trader had stopped trading after the first losing streak of 13 losses, they would have missed out on all the gains that came to those who continued to trust and follow their trading process.
Having accurate expectations about the size of potential losing streaks is helpful for crafting a risk management plan to tolerate losses. Following a plan like that helps a trader avoid mistakes caused by emotionally-driven trading.
In this lesson we’ve discussed how important it is to plan for worst-case scenarios and maximum drawdowns. Such a plan helps you to keep confidently trading your system long enough to see its benefits. Our next video will discuss risk management from a standpoint of allocation strategies as part of an overall trading plan.
Allocation strategies of an overall trading plan
Ray Dalio, the founder of the world’s largest hedge fund, has said that “diversifying well is the most important thing you need to invest well.”
Yet many traders get so focused on the opportunities that they don’t take the time to quantify a diversification strategy. This tendency is especially prevalent in those with smaller account sizes who also feel a need to catch up and grow their accounts quickly.
Allocation and trade risk management strategies may at first seem likely to reduce the speed of potential growth. Yet suffering big losses is even worse. A loss of 50% requires a gain of 100% just to break even whereas a loss of 10% requires just an 11% gain to breakeven.
Traders who want to really grow their accounts should start out by setting up their trading process in a way that limits their losses and reduces their exposure as a way to avoid big losses. This is best accomplished by establishing allocation and risk per trade rules.
Diversification is deciding how much of your available capital to risk in penny stocks. Once that is decided, allocation rules determine how much money you’ll put into any one trade. Stop loss rules set the total amount risked per trade. If there is no stop loss, then the total amount risked per trade is equal to the total amount allocated to that trade.
Good risk management practice for penny stocks is to allocate just 20% of the money for penny stocks and risk just 1% of the available capital on any one trade.
So if a person has allocated $5,000 for penny stocks, a standard allocation strategy is to put $1,000 into 5 different positions and a standard risk approach is to set stop losses such that the total amount risked is $50 ($5,000 x 0.01 = $50).
In this scenario, the trader could have as many as 5 live trades with a total amount at risk of $250. As time passes and the trader experiences losses and gains, it’s important to periodically review the total account balance and reallocate the amount they want to put into each trade.
Setting standardized allocation and risk-per-trade amounts is one of the elements of a trading process that is predictable and repeatable. Uneven allocations or risk-per-trade amounts means some trade outcomes have more impact on the portfolio than others.
Allocating the same amount of money to each trade reduces risks and increases the likelihood of long-term profitability. Each loss represents a similar small amount of total dollars, while each gain is 2.75 higher. In this case, the total amount lost on each losing trade is $50 while each winning trade would contribute $137.50 in gains.
Losses are a part of any trading system. The losses that are exceptionally painful are the ones that were once profitable trades. Our next lesson describes ways a trader can avoid these types of losses while banking profits along the way.